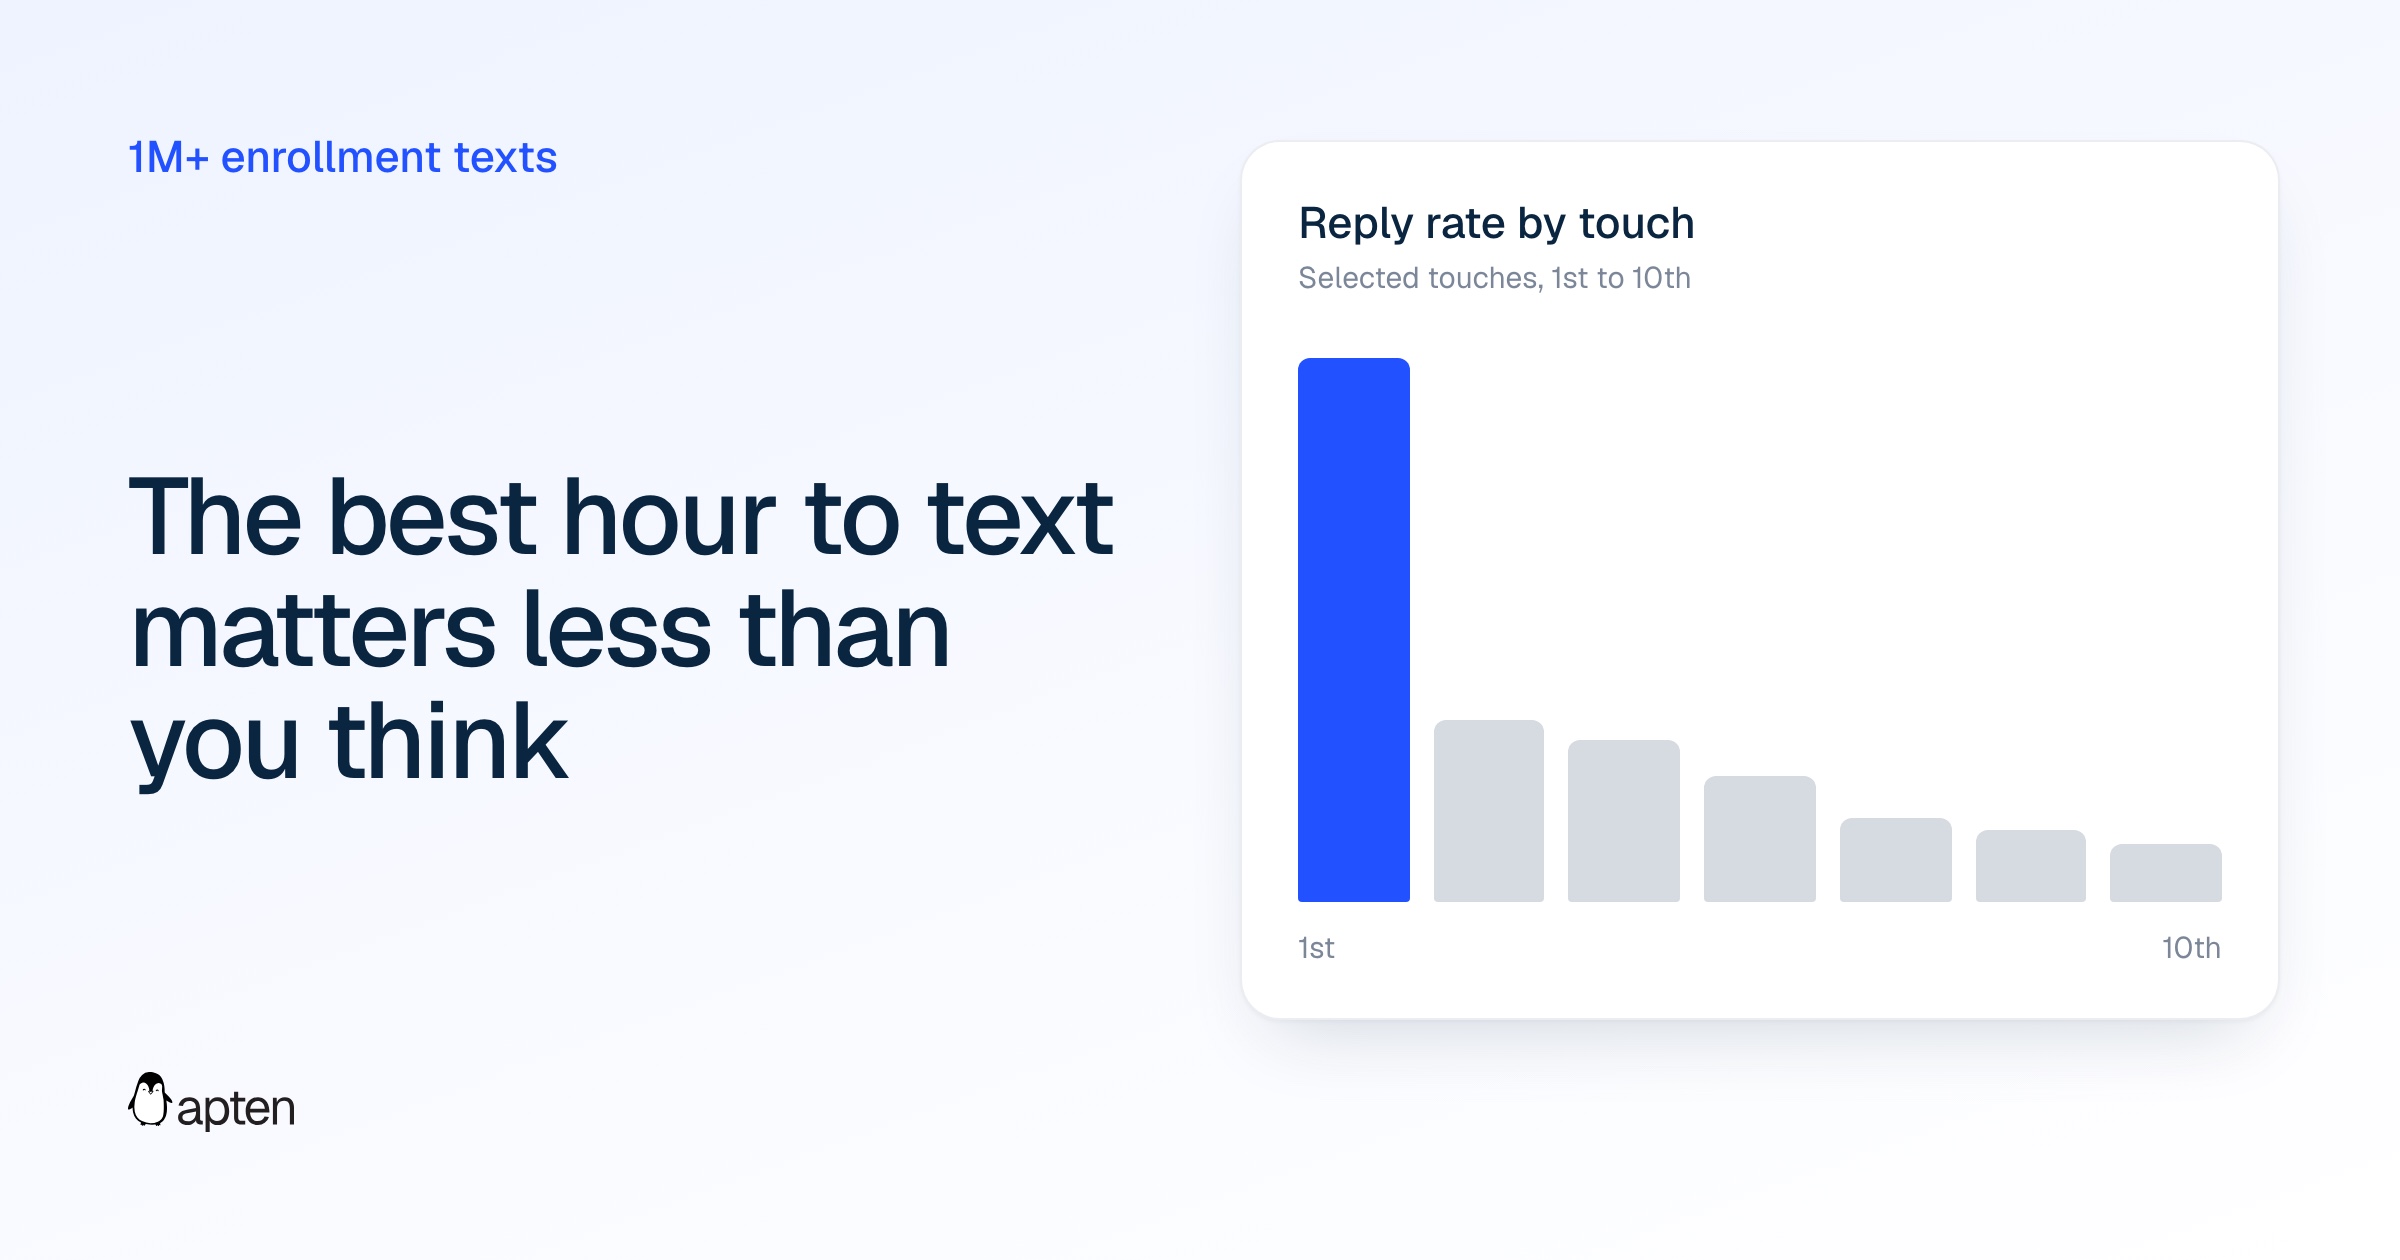
There's no meaningful best hour to text a prospective student. When we studied more than a million enrollment texts, the send hour barely changed whether students replied. Which touch it was changed reply rates about ninefold: 27.2% on the first text, 2.9% by the tenth. A new inquiry should get a text right away, at any hour, and later follow-ups don't need much hour-by-hour tuning.
That's not what most advice says. Search this question and you'll find confident windows: midday, early afternoon, 8 to 9 p.m. We started out believing a version of that too. An earlier analysis of ours showed student messages peaking at 9 to 10 a.m. on Mondays, and we nearly published it as student demand. Then we asked whether we were just measuring our own outreach. We were.
Why most best-time-to-text charts mislead
Most timing charts count replies by hour. But replies follow sends, so a busy send hour will always look like a great reply hour.
Our own data shows how strong this effect is. In our data, 27% of proactive texts and calls went out in the 9 a.m. hour, largely because messages scheduled too early wait for the outreach window to open. In each school's 10 busiest inbound hours, 84% of inbound came within an hour of proactive outreach to that student. At the median school, only 3% of inbound came with no outbound in the previous 24 hours.
Published benchmarks often can't rule this out:
Meera's 2025 benchmark covers 35 million SMS interactions. It finds that replies peak around noon and calls midday the most reliable time to send. The page doesn't publish how many texts went out each hour.
Mongoose's admissions benchmarks list high-engagement windows of 1 to 2 p.m. and 8 to 9 p.m. The page doesn't say whether those are send times or reply times, or give a sample size for them.
Recart's study of 30,000 retail SMS campaigns shows that sends themselves cluster, with 16.1% of messages going out at noon. It isn't about enrollment, but it shows why a noon reply peak proves little without send counts.
None of this makes those windows wrong. It means a reply count can't tell you they're right.
What we measured
We looked at proactive texts from Apten education customers between July 28 and October 25, 2026, in each student's local time. That's more than a million first texts and scheduled follow-ups. We left out conversational replies and sends flagged as failed. Schools vary a lot in size, so we mainly report the median school.
For each text, we asked one question: did this student reply within 24 hours? Then we made three adjustments that most timing charts skip:
Compare each school to itself. One school's 3 p.m. isn't comparable to another's, so every rate is a share of that school's overall rate. An index of 1.0 means average for that school.
Control for who gets texted when. We standardized for touch number and whether the lead was imported, because morning sends skew toward colder follow-ups.
Compare the same student across hours. For students who got texts at different times, we checked whether they replied more at one hour than another.
Does the time of day change reply rates?
Barely. The raw numbers suggest otherwise, and that's the trap. Texts sent at 9 a.m. got replies 6.3% of the time, against 10.4% at 3 p.m. It looks like a 65% lift.
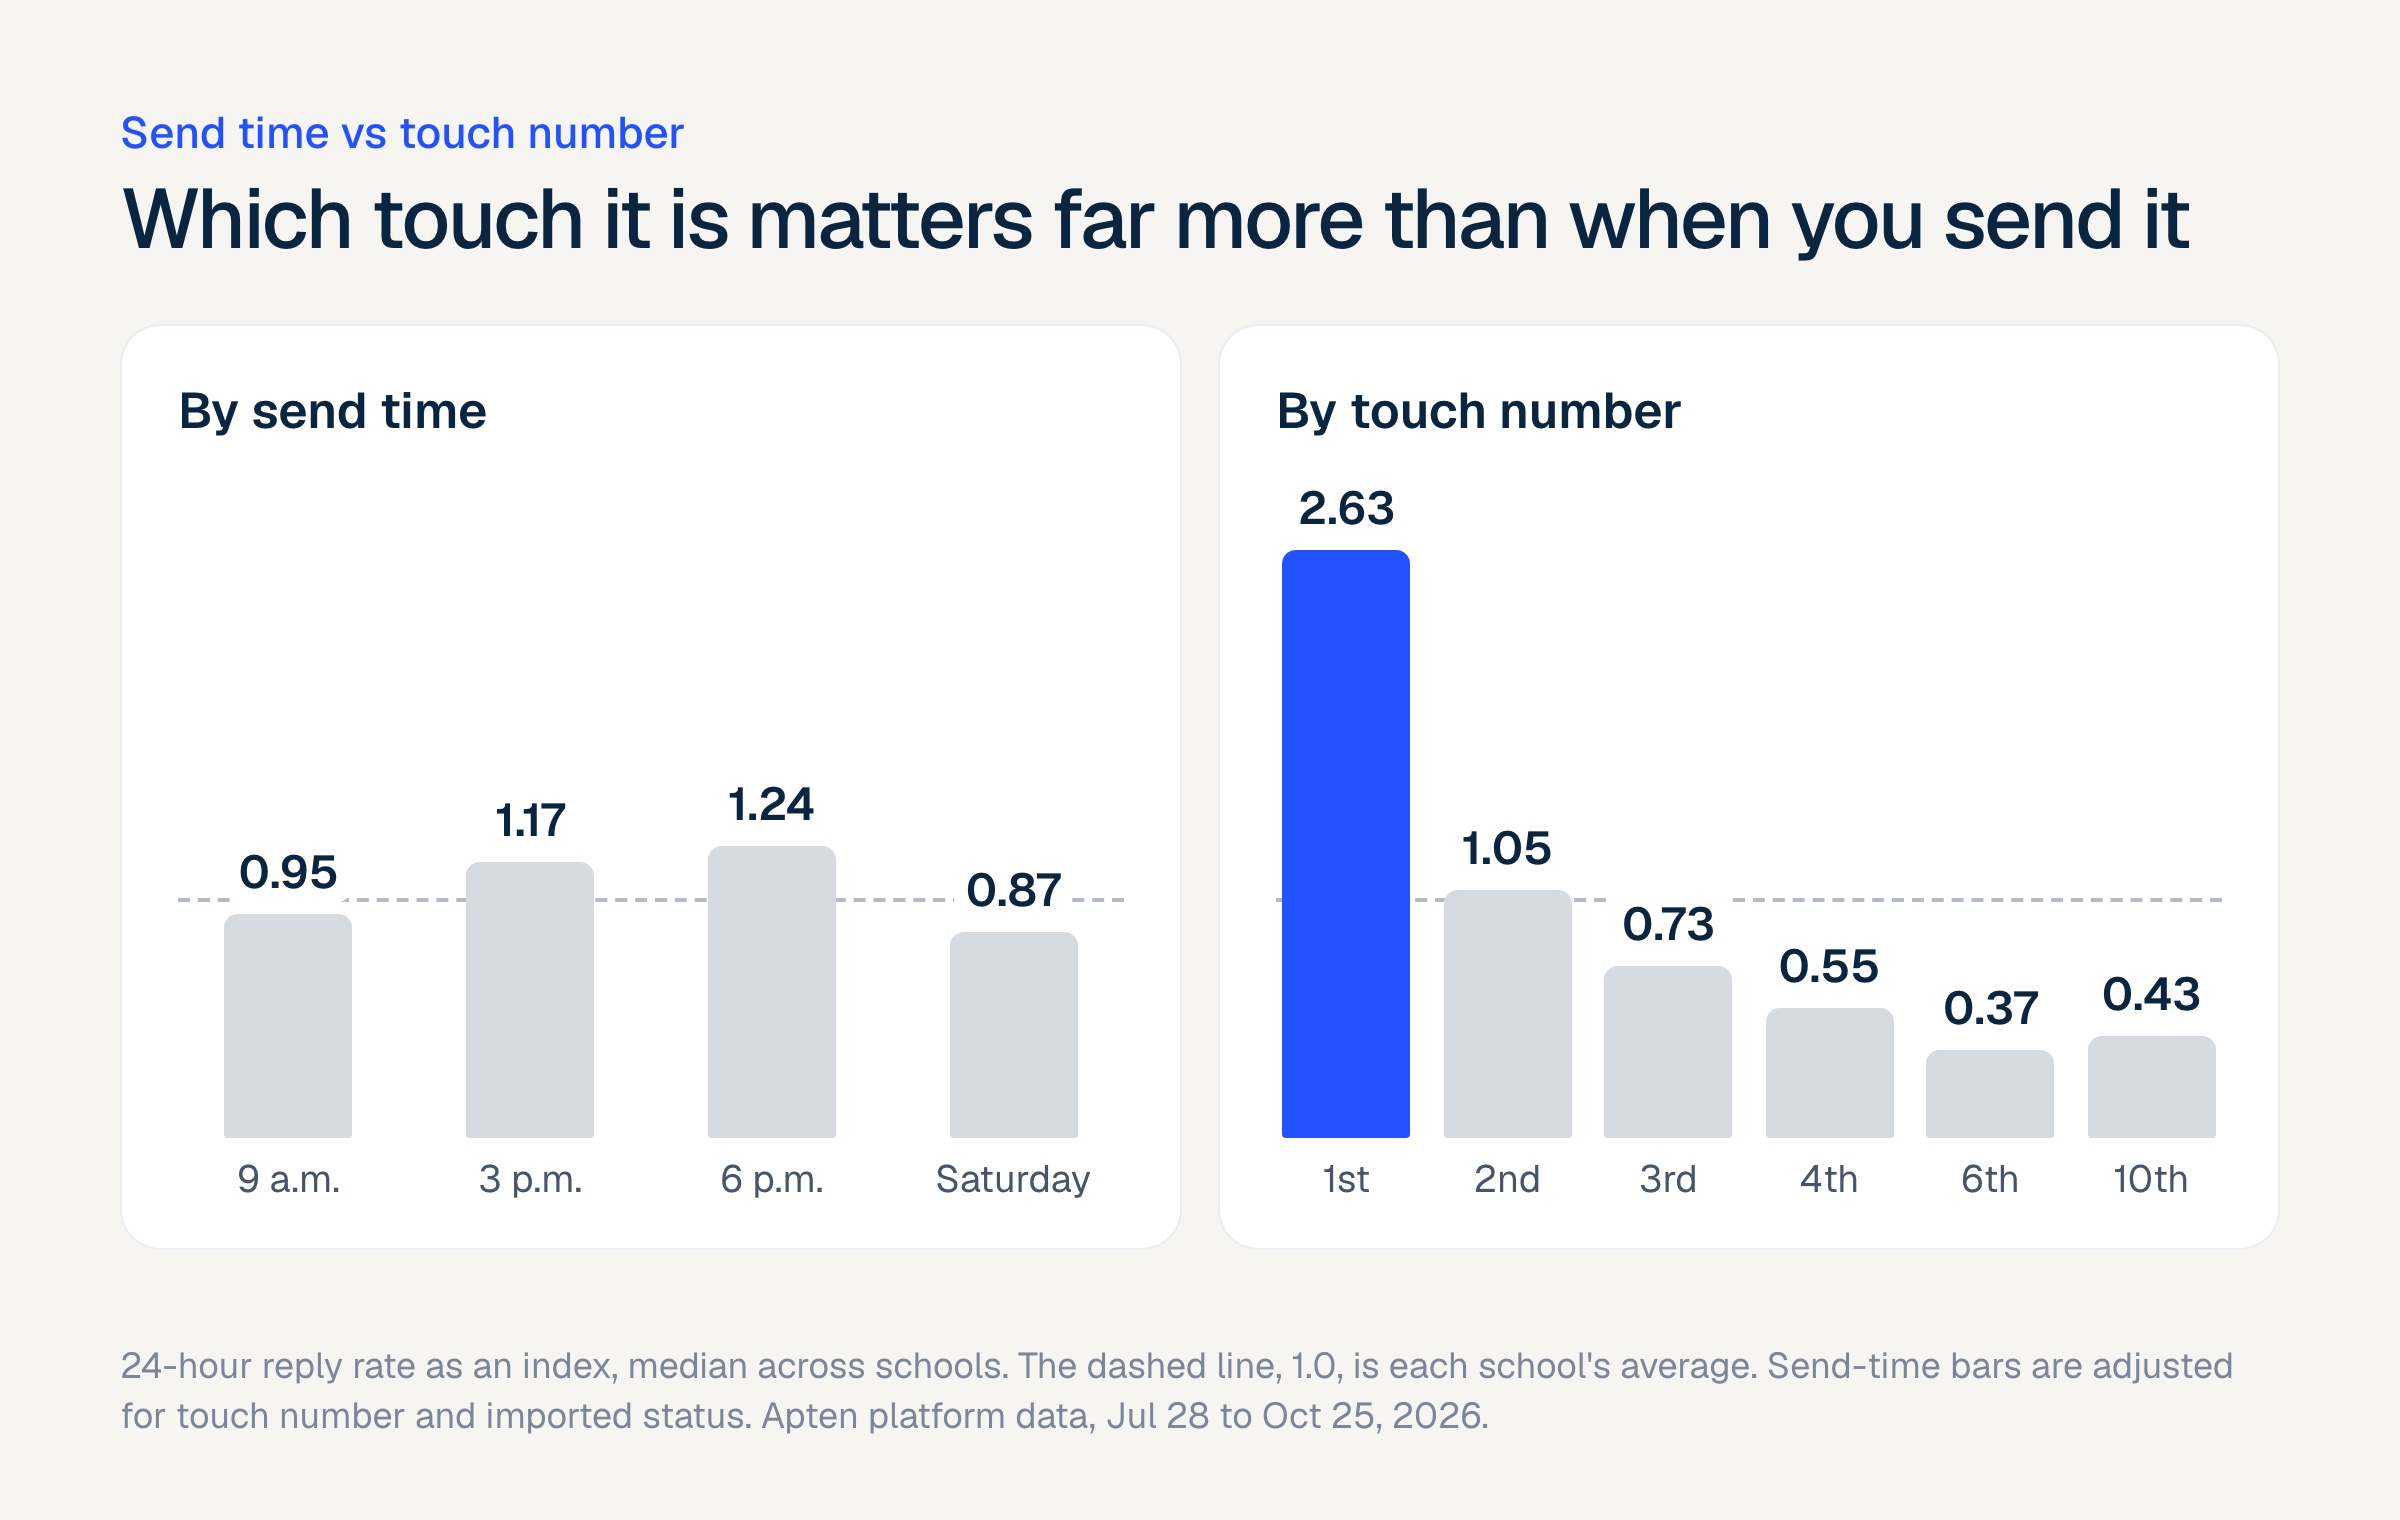
Most of that gap is who was being texted. After adjustment, 9 a.m. sits at 0.95, close to average. Afternoon and early evening stay somewhat higher, with 3 p.m. at 1.17 and 6 p.m. at 1.24. Then the same-student comparison removes most of what's left: morning texts ran just 0.46 percentage points behind afternoon texts, and schools split about evenly on it.
| Send time | Raw 24-hour reply rate | Index, school vs itself | Index, adjusted | Pattern across schools |
|---|---|---|---|---|
| 9 a.m. | 6.3% | 0.73 | 0.95 | Most below average |
| 3 p.m. | 10.4% | 1.22 | 1.17 | Nearly all above average |
| 6 p.m. | 10.2% | 1.18 | 1.24 | Most above average |
| Saturday | 7.3% | 0.75 | 0.87 | Most below average |
For a new inquiry's first text, the hour made almost no difference: 0.95 to 1.13 across the day, with no clear pattern. The small afternoon edge showed up in follow-ups. On the first two, morning texts ran about 25% behind afternoon texts after adjustment. That's the one place a schedule test could pay off.
The weekend dip was the most consistent timing result, and it was small. Saturday ran about 13% below average after adjustment.
This isn't a new idea in sales. A 2016 Velocify report on sales calls found just 2.6 percentage points between the best and worst hour to call. Sequencing calls from the moment of interest improved contact rates by 110%, against 7% for a time-of-day approach. Our data covers a different channel, a decade later, and points the same way.
What matters more than send time?
The first touch
The first text got a reply 27.2% of the time, and the second got 9.1%. That was the biggest drop in the sequence, and the first touch beat the average at every school. By the sixth touch, the curve flattens at around 4%.
Students who had never replied fell further: 6.9% on the second touch, 4.4% on the fourth and 1.6% on the tenth.
| Touch | Reply rate, all students | Reply rate, never replied before |
|---|---|---|
| 1st | 27.2% | 27.2% |
| 2nd | 9.1% | 6.9% |
| 3rd | 8.1% | 5.2% |
| 4th | 6.3% | 4.4% |
| 6th | 4.2% | 2.8% |
| 8th | 3.6% | 2.1% |
| 10th | 2.9% | 1.6% |
Part of that drop is selection, since the students most likely to reply do so early. Even so, the first message is your best shot at a conversation. It's where a team should put its effort: what it says, how fast it goes out, and who's ready when the student answers. RNL reports that more than 60% of graduate students will likely or definitely enroll in the program that responds to their inquiry first.
Being there for the reply
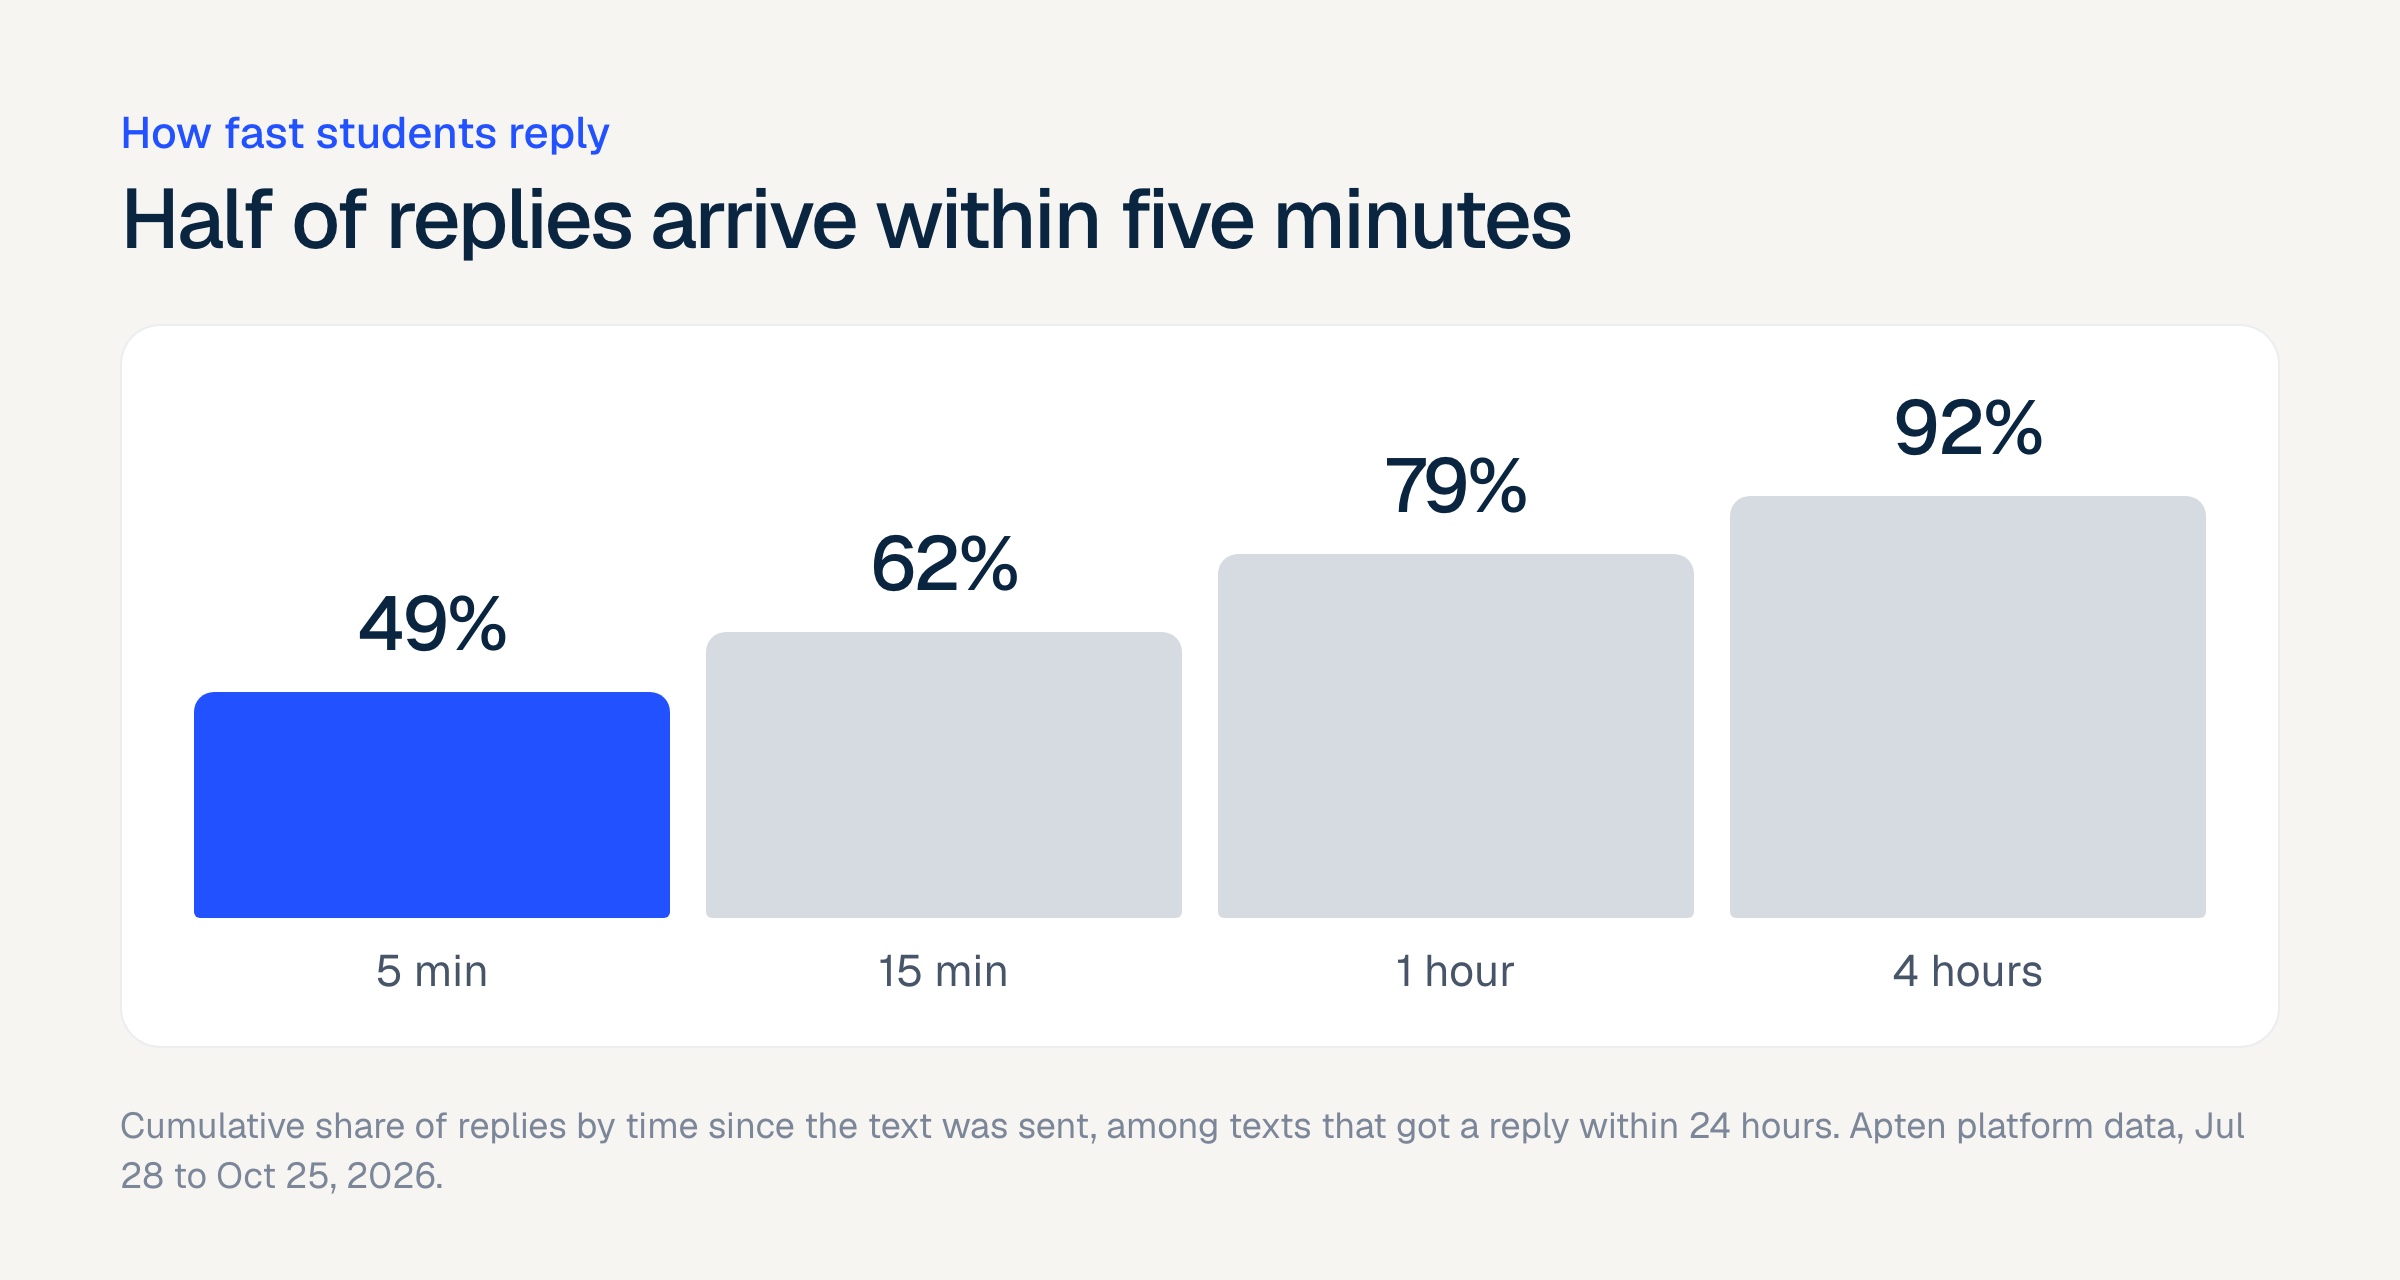
When students reply, they do it fast. Among replies, 49% arrived within 5 minutes and 79% within an hour. So your send schedule is also your staffing schedule. If a batch goes out at 9 a.m., most of its replies land before 10.
Answering after hours
New inquiries don't depend on your send schedule, so they're a cleaner read on when students show up. At the median school, 56% of real-time inquiries arrived outside weekdays 8 a.m. to 6 p.m., and 24% arrived on weekends. Some of those may be CRM batches we couldn't identify, so treat these as approximate.
Waiting until morning is the one timing choice we'd avoid, even though we can't prove the cost from this data. Few schools on Apten hold inquiries for long, so there's no delayed group to compare. Speed-to-lead research and RNL's numbers both point to answering first.
How to apply this to your text outreach
Answer every new inquiry immediately, at any hour. On Apten, the first text typically goes out within seconds of an inquiry arriving. If your team can't do that overnight or on weekends, an AI enrollment agent can.
Spend your testing on the first two messages. Rewriting them can move a 27% and a 9% number. Moving send hours is working on a much smaller effect.
Plan advisor time around your own send schedule. Half of replies come within 5 minutes, so don't send a large batch unless someone can answer. If warm transfers to advisors are part of your flow, spreading sends through the day should also spread out the handoffs.
Don't read much into batch results yet. The largest sends got fewer replies than the smallest (about 15% fewer after adjustment, at most schools), but first touches showed no such drop. Big batches often go to colder lists, so this doesn't show that volume itself hurts.
Set a stopping rule for students who never reply. Reply rates alone won't set it. Weigh a 2% or 3% reply rate against your opt-outs and your cost per enrolled student. Our guide to AI follow-ups covers how to plan the sequence.
Stay inside the legal window first. Federal rules bar telephone solicitations before 8 a.m. or after 9 p.m. in the recipient's local time, and some states are stricter. Washington's limit ends at 8 p.m., for example. Ask counsel which rules apply to your messages. Our TCPA and state law guide is a starting point. This isn't legal advice.
How to check this on your own data
You don't need our numbers, and your program may differ. Most teams can run this from a CRM or texting platform export in an afternoon.
| The question | The misleading version | The better version |
|---|---|---|
| When do students respond? | Replies per hour | Replies within 24 hours, divided by texts sent in that hour |
| Does 3 p.m. beat 9 a.m.? | All texts pooled | Same touch number, separately for new and imported leads |
| When do students reach out on their own? | All inbound messages | New inquiries, plus inbound with no outbound in the prior 24 hours |
| Are big sends hurting us? | Reply rate by batch size | The same comparison for first touches and follow-ups, within the same list type |
To get a real answer on send time, test it. Randomly split the same follow-up across two send windows and compare reply and opt-out rates. It's the one thing our data can't do.
What this data can't tell you
Send time wasn't randomized. Schools, profiles and campaigns all favor certain hours, and we didn't control for every one. The same-student comparison can't rule out an effect of about 10% in relative terms.
A reply isn't an enrollment. Replies include opt-outs, though counting opt-outs separately barely changed the hour results. We didn't measure enrollment by send hour.
These are Apten customers. They use AI agents with fast first replies, and other programs may see different rates.
Touch numbers include calls and emails. We only have touch numbers for leads created since July 1.
This is about texts. Don't assume it applies to calls.
How Apten handles outreach timing
Apten is a multichannel AI enrollment agent for online programs and large enrollment teams. It texts a new inquiry within seconds, day or night, then carries on the conversation across text, voice, email and webchat with the same memory.
You set outreach hours for your organization or for each agent profile. Follow-ups that fall outside them are rescheduled, and you can add state-specific rules. The Response timing view in Metrics shows response rate by day and hour alongside raw inbound and outbound counts, so you can see the difference between when you sent and when it worked.
Each week, the Optimize report ranks your follow-up strategies by reply rate and recommends changes, with the evidence attached. You approve what ships. To test a change properly, profile variants split new leads across versions so you can compare the results.
The takeaway
Stop looking for the perfect hour. Answer new inquiries right away, put your effort into the first two messages, and make sure someone can respond when your sends go out. If you want to know whether send time matters for your program, run the test.
Book a 20-minute demo to see this on your own conversations, or learn more at apten.ai.
Sources
Apten platform data, education customers, Jul 28 to Oct 25, 2026, aggregate only: more than a million proactive texts, plus replies and real-time inquiries. Index values are medians across schools.
Velocify, Research Shows Time of Day Has Minimal Impact on Sales Effectiveness (May 2016)
RNL, Lead to Enrollment and the Importance of Speed to Lead (2025)